The Net Lease Market Inflection Point
The 2022–2023 interest rate cycle was the most significant shock to the net lease market in 15 years. As the Fed raised rates from 0.25% to 5.5%, NNN transaction volume fell 35% from its 2021 peak, cap rates expanded 75–125 basis points across most tenant categories, and many deal structures became uneconomical for leveraged buyers.
As we enter 2025, the market is at a clear inflection point. Rates have stabilized, transaction volume is recovering, and several market dynamics are creating both opportunity and risk for NNN investors.
Where Cap Rates Stand in 2025
QSR / Fast Food
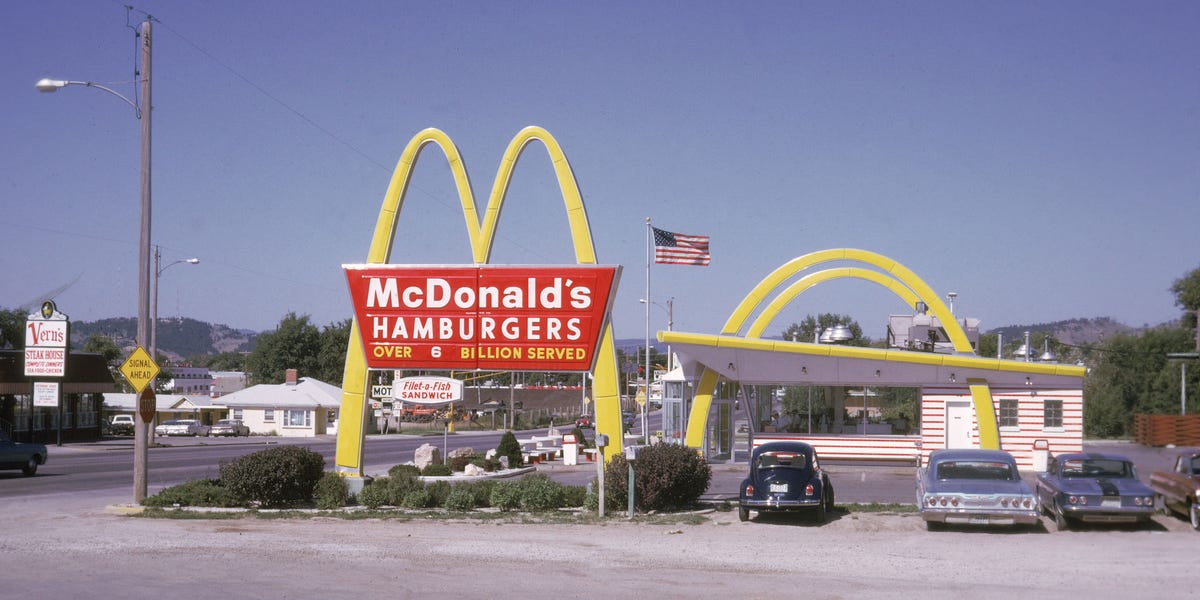
McDonald's (corporate): 4.5–5.25% | Chick-fil-A: 3.75–4.75% | Starbucks drive-thru: 4.5–5.25% | Taco Bell: 5.0–5.75%
Pharmacy
CVS: 5.25–6.5% | Walgreens: 6.0–7.5% (reflecting credit downgrade)
Dollar Stores
Dollar General: 6.0–7.15% | Dollar Tree: 5.75–7.25% | Family Dollar: 6.5–8.0%
Auto Parts
AutoZone: 5.5–6.75% | O'Reilly Auto Parts: 5.25–6.5%
Convenience / Gas
7-Eleven: 5.0–6.0% | Wawa: 4.75–5.75% | QuikTrip: 5.0–5.75%
Transaction Volume Trends
Single-tenant net lease transaction volume reached $68B in 2021 — a record. It fell to $42B in 2023 following rate increases. 2024 saw $51B — a clear recovery — and our 2025 outlook projects $58–62B as rate stability and motivated sellers drive deal activity.
The key driver of increased 2025 volume: investors who bought at 2019–2021 prices on short-term variable-rate debt are facing financing maturity. These forced sellers will create acquisition opportunities for patient, equity-heavy buyers.
The 1031 Exchange Engine
1031 exchange activity drives a disproportionate share of NNN demand. As high-income investors sell appreciated multi-family, commercial, and land positions, the regulatory requirement to reinvest proceeds creates reliable NNN demand regardless of financing market conditions.
We estimate 1031 exchange buyers represent 30–40% of all private NNN buyer activity — and this cohort is largely insensitive to interest rate cycles because they're typically buying all-cash or at low leverage.
The ESS Group's 2025 Investment Thesis
Based on our market analysis, the most compelling NNN investment opportunities in 2025 are:
- Secondary market QSR ground leases (Nashville, Raleigh, Indianapolis): Cap rates of 5.0–5.75% with superior population growth vs. gateway markets
- Walgreens high-volume locations with 15+ year leases: Cap rate premium compensates for credit risk at quality sites
- New construction Dollar General in suburban Sunbelt markets: 15-year fresh leases at 6.25–7.15% in growing population corridors
- AutoZone/O'Reilly in "essential retail" corridors: Recession-resistant auto parts category with strong credit and moderate cap rates
Looking Ahead to 2026
If the Fed continues rate normalization and financing costs drop to 5.5–6.0%, we anticipate further cap rate compression of 25–50 basis points in primary Sunbelt markets — meaning assets purchased at today's cap rates would appreciate 4–8% on yield compression alone, before any rent growth. The window for buying at today's cap rates may be narrow.
Contact The ESS Group for our complete 2025 NNN Market Report with property-specific acquisition recommendations. Available to qualified investors.
Ready to Invest?
Our advisors specialize in sourcing premium off-market NNN properties for high-net-worth investors and 1031 exchanges. Contact The ESS Group to see available inventory.